• Skip to primary navigation
  • Skip to main content
  • Skip to footer
DAILYNOMIE

DAILYNOMIE

Know Thyself

  • 🏑 Home
  • πŸ“² INSTALL
  • πŸ“– DOCS
    • πŸ“– Overview
    • πŸ’§Track Tab
    • πŸ•¦ Timeline Tab
    • πŸ“ˆ Dashboard Tab
    • πŸ… Goals Tab
    • ⁉️ WHATS UP
    • 🧰 Trackable
    • πŸ”Ž Super Search
    • πŸ’Ύ Storage Types
    • βŒ› Back in Time
    • ☁️ Sort/Remove
    • 🧊 Analytics
    • πŸ“Έ QR Codes
    • δ·• AfterNomie
  • πŸ”Œ PLUGINS
    • πŸͺ Nomie API
    • πŸ”„ Nomie Sync
    • 🧱 Blockly
    • πŸ‘¨β€πŸ‘©β€πŸ‘§β€πŸ‘¦ My People
    • πŸ“† Memories
    • πŸ’¨ Weather
    • πŸ§˜πŸ½β€β™€οΈ Meditate
    • βš–οΈ My Balance
    • ☁️ WordCloud
    • πŸ’¬ Quotes
    • 🫁 Breathe
    • ⏲ Fasting
    • πŸ’ͺ 7MinWO
    • ⌚️ Apple Watch
  • πŸ“” TUTORIALS
  • ⌚️ APPLE WATCH
  • 🎁 RELEASES
  • πŸͺ API
  • πŸͺ’API Connectors
    • πŸͺ’IFTTT
    • πŸͺ’ IOS Sortcuts
    • πŸͺ’ QR CODES

MYNOMIE

DailyNomie Location Fix

11 August 2023 by rdl

While doing maintenance on the code I thought that I caused an issue with managing your locations in Nomie. While I was testing functionality I was not able to properly managing the locations database. After digging into the issue it appeared that this was not caused by any maintenance activities, but a bug which apparently was already existing in the code. I have now fixed that and included an option to manage your locations in the settings page. It will soon be available in the production instance of DailyNomie:

DailyNomie Context in Charts

4 August 2023 by rdl

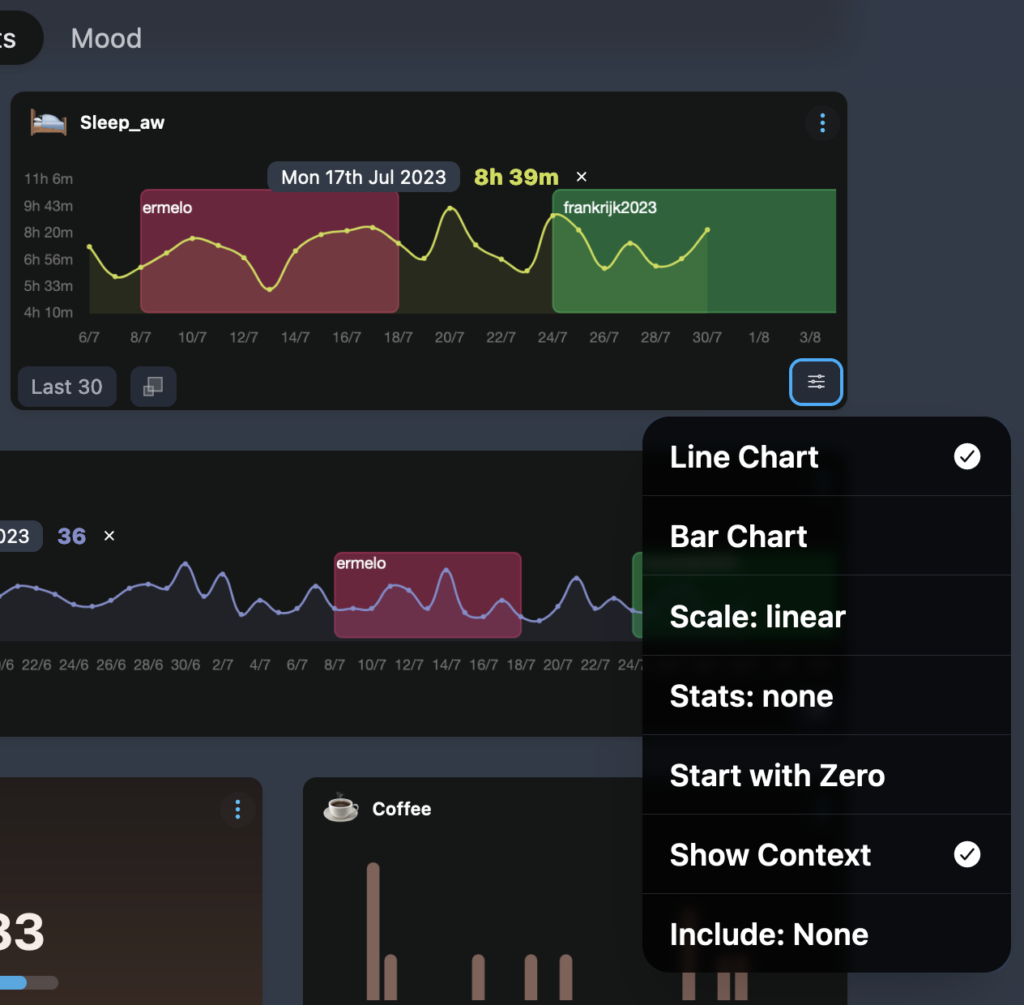
While maintaining DailyNomie during July and August I found some code I wrote earlier which will enable you to show context in your line and bar charts in the Dashboard view. The context is already visible in the Timeline Tab, but this is not providing an overall view on how specific context (like vacation) is impacting factors in your life (like sleep or heart rate variable). Below you will see an example how it will look like:

You can simply switch between showing / hiding the context via the settings icon in the right bottom corner in the chart:

I hope this additional feature makes sense. It will be available in the course of August in the updated production instance.

As always…happy tracking!

DailyNomie Maintenance Mode

16 July 2023 by rdl

After releasing the Analytics Platform it is time to dedicate some time to maintain the DailyNomie instance of Nomie.

What do I mean with Maintenance Mode? Next to developing new features, the DailyNomie instance needs to be maintained. Some 3rd party dependencies have introduced new releases which I need to include in the DailyNomie instance to be on par and to make sure that I stay compliant and upto date. The vacation period is a great period to work on this. So during the months of July and August I will not work on new features, I will maintain the instance and only fix (urgent) bug fixes when applicable.

Enjoy the vacation period!

DailyNomie Analytics Ready

2 July 2023 by rdl

This weekend I finalyzed the last bits and bytes on the DailyNomie Analytics Platform. I have just published version 6.5.0-dn of DailyNomie which contains the beta version of the Analytics platform. If you are already using DailyNomie you will be upgraded automatically to the new version with the new feature.

In order to bring you up to speed with the platform I have documented the different capabilities as part of the documentation. So if you would like a quick start…here you go: 🧊 Nomie Analytics

Have fun with it!

DailyNomie Analytics…almost Ready

25 June 2023 by rdl

The past week I have further developed the Analytics module as part of Nomie6-oss. In order to create this feature, I have rebuild the pivottable.js package and embedded this package in Nomie.

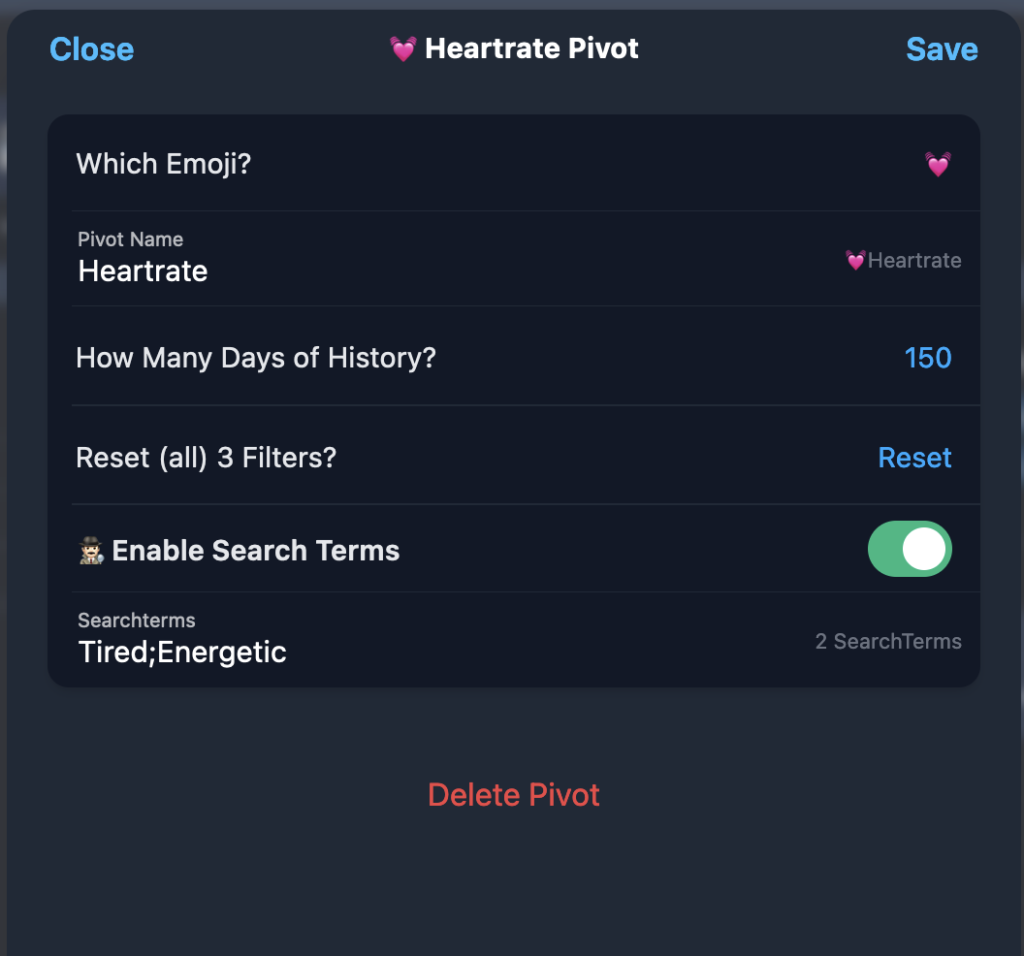
I already shared some screen casts last week where you could already see the basic usage. On top of this basic usage I have now introduced some additional features which you can configure in the pivot editor:

As per above screenshot you have the following options:
– Set the amount of days of history data you would like to retrieve. Be aware, the more days you choose, the longer it takes before your pivot is loaded
– Reset Filters. With this option you can reset all your filters in one go. This is handy when you lost your view on all the filters you set as part of the active pivot
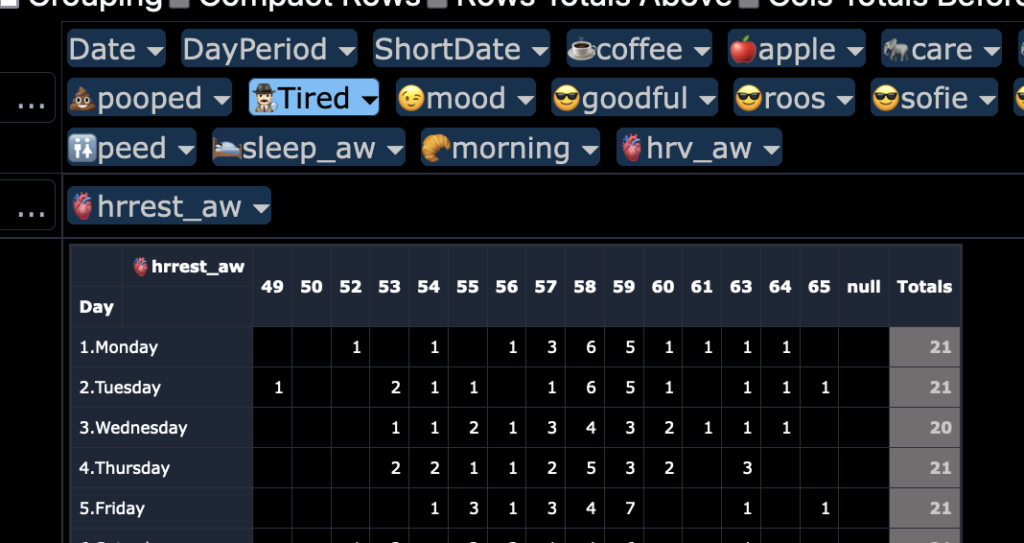
– Searchterms. You can enter free format search terms which will then be searched in all your notes for the amount of days back you selected. The amount of hits per day will become part of your dataset for each search term. Searchterms should be semicolon separated.

The searchterms will be light blue colored as part of your dataset:

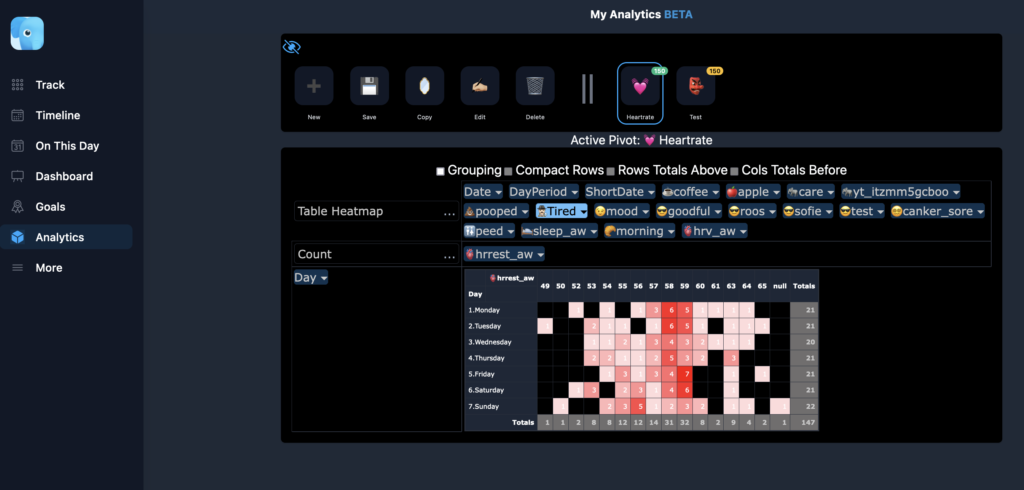
A final feature I have included is the option to set the default pivot which will load when you open the Analytics area. You can recognize the default pivot by the green indicator. The number in the green indicator represents the days of history for this pivot. You can simply make another pivot default by clicking on the orange indicator:

Finally, a screenshot of how a heatmap table could look like:

For those who cannot wait, you can already run Nomie from https://dev.dailynomie.com

This instance already includes the analytics module.
As always: happy tracking!

DailyNomie Analytics

16 June 2023 by rdl

Hi all, a short message to let you know what I am working on. This is a spoiler of a new feature which I will introduce soon in a new DailyNomie version of Nomie.

Nomie already provides a large amount of analytics options, but I recently spoke with somebody who would like to have more advanced options to data crunch his Nomie database. Although I believe that sometimes ‘less is more’, I thought it would be a nice challenge to introduce a platform within Nomie which allows for further Analysis of your data. As such πŸ’‘Nomie Analytics was born.

Currently this new option is in Beta, but I thought it would be nice to show you what the potential of this feature is.

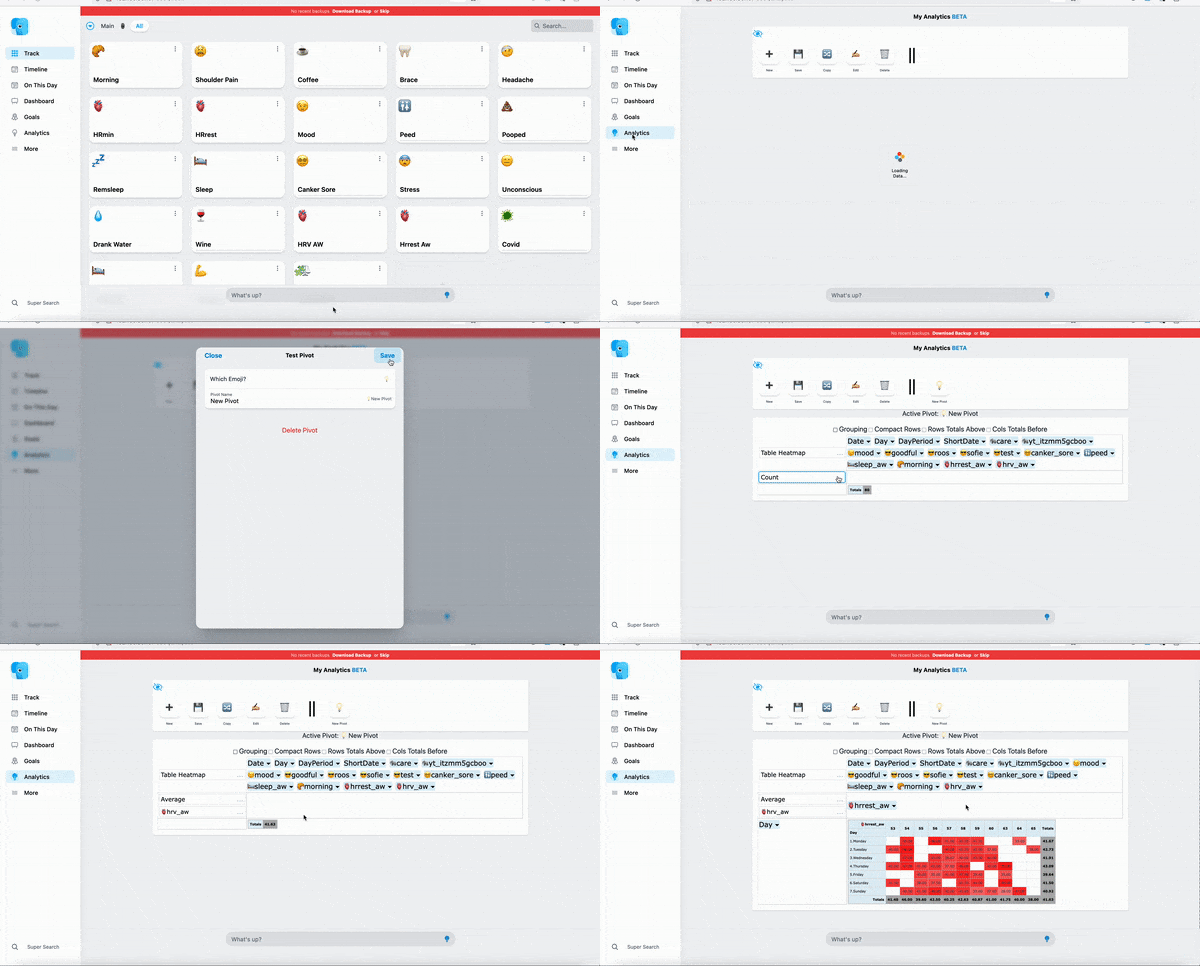
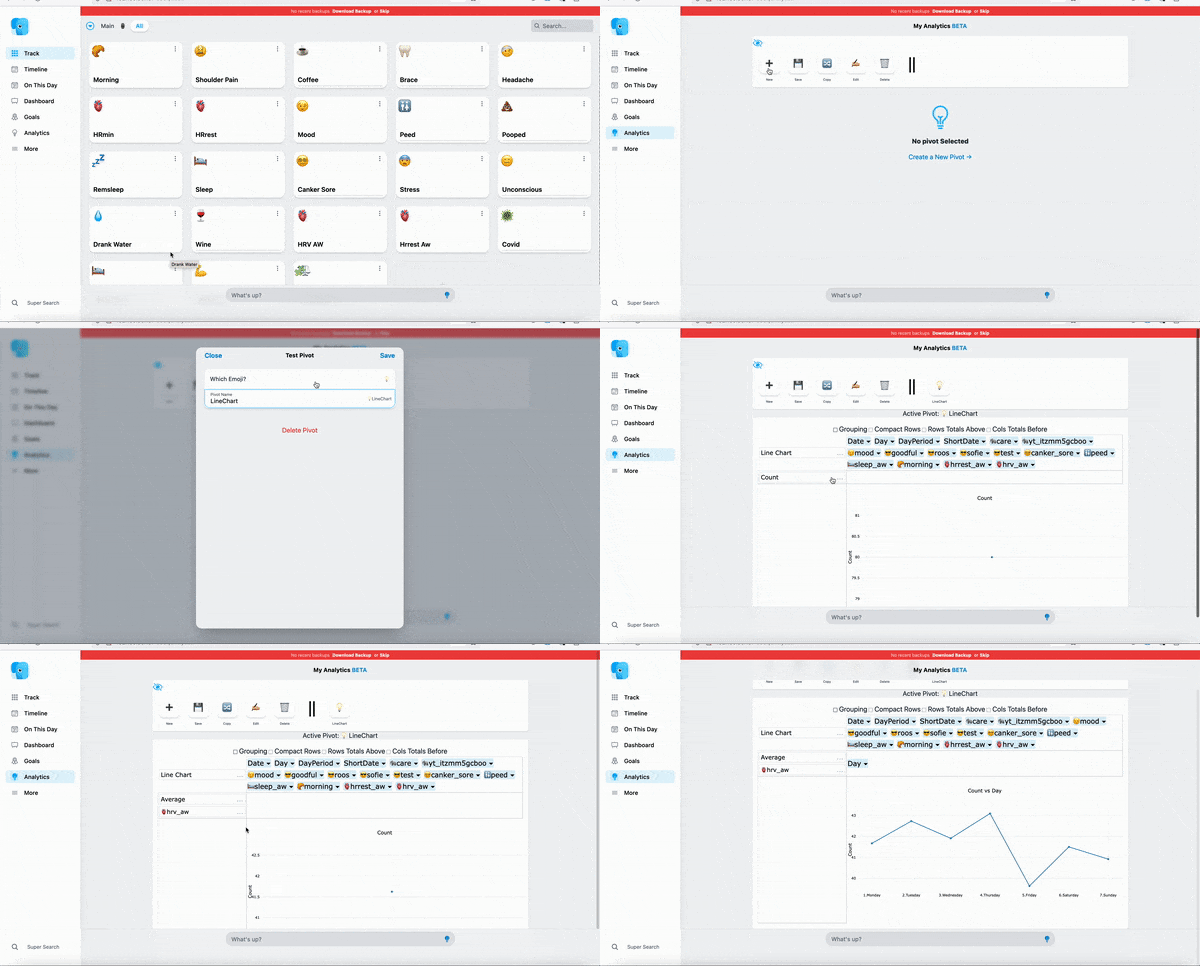
πŸ’‘Nomie Analytics is best viewed at a large screen (laptop/tablet), but it also works on your mobile if you really want to 🧐. Below you will find the first 2 demo’s of this new feature.

The first demo shows how you can easily create a heat map from a couple of trackables in Nomie. This provides you with an easy way to analyze the correlation between these trackables:

The second demo below shows how you can create charts from your data. The demo shows a simple line chart out of 2 datasets, but you can create very complex charts if you want. After creating a so called ‘pivot’ you can save the configuration of this pivot so it will be available for future usage!

I will need some days to finalize the details and to fix a couple of bugs. Soon I will make it available as Public beta. In the mean time, if you have further suggestions, let me know. I might be able to incorporate these.

For now: happy tracking!

« Previous Page
Next Page »

Footer

NOMIE

Nomie and the Blue Elephant are registered Trademarks of Happy Data, LLC. Indianapolis, IN.

DAILY NOMIE

Daily Nomie is maintained by Ronald de Lange. For any remarks or questions, please reach out to me via ronald_de_lange@hotmail.com

ME – THE DAILY NOMIE MAINTAINER

Our website uses cookies to provide you the best experience. However, by continuing to use our website, you agree to our use of cookies.