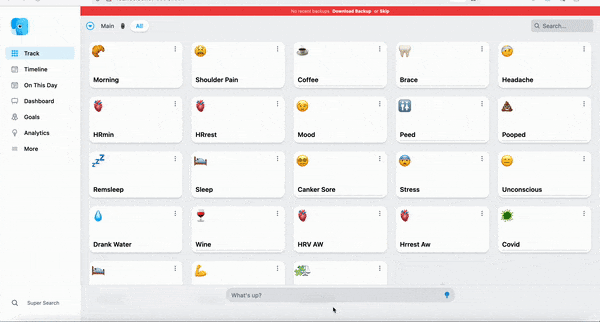
Hi all, a short message to let you know what I am working on. This is a spoiler of a new feature which I will introduce soon in a new DailyNomie version of Nomie.
Nomie already provides a large amount of analytics options, but I recently spoke with somebody who would like to have more advanced options to data crunch his Nomie database. Although I believe that sometimes ‘less is more’, I thought it would be a nice challenge to introduce a platform within Nomie which allows for further Analysis of your data. As such 💡Nomie Analytics was born.
Currently this new option is in Beta, but I thought it would be nice to show you what the potential of this feature is.
💡Nomie Analytics is best viewed at a large screen (laptop/tablet), but it also works on your mobile if you really want to 🧐. Below you will find the first 2 demo’s of this new feature.
The first demo shows how you can easily create a heat map from a couple of trackables in Nomie. This provides you with an easy way to analyze the correlation between these trackables:
The second demo below shows how you can create charts from your data. The demo shows a simple line chart out of 2 datasets, but you can create very complex charts if you want. After creating a so called ‘pivot’ you can save the configuration of this pivot so it will be available for future usage!
I will need some days to finalize the details and to fix a couple of bugs. Soon I will make it available as Public beta. In the mean time, if you have further suggestions, let me know. I might be able to incorporate these.
For now: happy tracking!